Project 3: Isosurfaces
Handed out: Friday, February 15, 2013
Due: Sunday, March 3, 2013
Overview
Data description
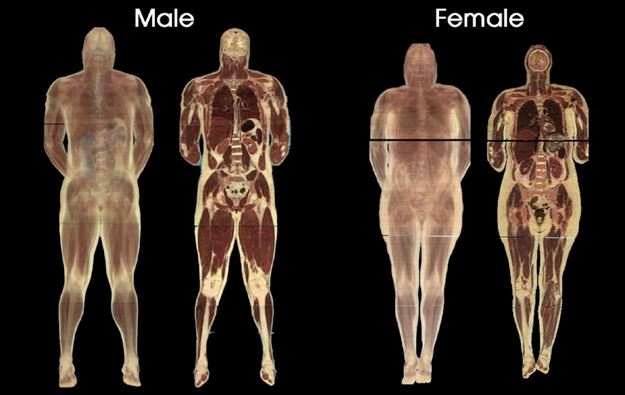
The data corresponds to CT scans of a human female head and feet, courtesy of the Visible Human Project. For each dataset I am providing you with a high resolution and a small version. The small resolution was created by halving the size of the original data along each direction (it is therefore 8 times smaller). For each resolution, you will find both a CT volume and an additional dataset corresponding to the magnitude of the gradient of the CT image. As a reminder, the gradient of a scalar field is the (vector) derivative. Here however, we are only interested in the magnitude of the derivative. In each case, the CT data is of type unsigned characters, yielding values between 0 and 255, while the gradient magnitude data is of type float. Note that the small resolution is mainly provided as a convenience for the testing phase of your implementation and I expect to see high quality results at full resolution in your reports. The interesting features in this dataset correspond to skin, bones, muscles and other soft tissues (e.g., brain).
Strategy
Your experimentation with the head dataset should allow you to identify values that correspond to the skin and the skull, respectively. Note in that regard that CT scans provide a different kind of information about internal organs than the MRI images that we considered in the previous assignment. In addition, you will use isosurfaces to try and reveal soft tissues such as muscles and brain white matter. In the foot dataset, you will use isosurfaces to reveal the bone structure as well the skin and surrounding muscles. Note that for each dataset, the CT and gradient magnitude volumes will offer you complementary means to find interesting features. To permit the selection of optimal isovalues, you will create a GUI that will let you select individual values associated with the various structures you are looking for. A slider bar will allow you to interactively browse the value range in search for the proper isovalue. The mitigate the occlusion caused by the nested structure the surfaces, you will be using transparency and / or a clipping plane. The latter will allow you to cut away the occluding part of the surfaces to reveal internal structures. Finally you will use color mapping to convey quantitative properties of the selected isosurfaces.
Tasks
This project consists in 6 individual tasks and a summary analysis that you should complete in the order they are listed. In each case, you are asked questions about the results you obtain that you must answer in your report.
-
1)Implement a GUI containing a slider bar to interactively select and change the isovalue(s) in a vtkContourFilter. Make sure to adjust the range of the slider bar to the interesting values in the dataset. Use this GUI to answer 2)
-
2)Use the vtkContourFilter module to extract and visualize isosurfaces corresponding to: skin, bones, muscles, and white matter (human head CT) and bones, muscles, and skin (human feet CT). Show high-quality images for each isosurface. Use a classification (discrete) color map mimicking real colors.
-
(a) Which isosurfaces look the most interesting? Justify your answer.
-
3)Same as 2) except that this time you will apply isosurfacing to the gradient magnitude volume. In this case, the value range will be very different (float values) and different isovalues will be of interest. Again, use your GUI to investigate both gradient magnitude datasets (head and foot). Use a color coding that you find appropriate for this part.
-
(a)What isosurfaces did you find interesting and why?
-
(b)How do these surfaces compare to the ones you obtained in 2)? Explain. Provide a detailed answer and justified the choices made.
-
4)Study the evolution of the isosurfaces obtained in 1) with respect to a continuous change of isovalue. For this part I am asking you to color map the gradient magnitude on the isosurfaces extracted from the original CT scans. Reuse here the color map that you selected in 3).
-
(a)How does each of these surfaces behave in this case?
-
(b)What relationship can you identify between this behavior and the associated gradient magnitude?
-
(c)What does that tell you about the value of the resulting visualization? Explain.
-
5)Write a program that displays in each dataset (feet and head) all the interesting isosurfaces together using transparency in the outer layers to address occlusion (skin hiding muscle hiding bones, etc...).
-
(a)Comment on your selection of the transparency for each isosurface.
-
(b)How does transparency benefit your visualization? Explain.
-
6)Write another program that adds one or several clipping planes (vtkClipPolyData) to the visualization to cut away certain pieces. Refer to Examples/VisualizationAlgorithms/Python/ClipCow.py. Implement a GUI that lets you control both the position and the angle of the clipping plane(s). This will enable you to interactively select the best view for your visualization and the images that you will produce for the report. You can either show the isosurfaces opaque or some of them transparent for this part.
-
(a)Comment on the choice of clipping plane position and orientation that you will be using for your images.
-
(b)How was the setting selected? Motivate your answer.
Summary Analysis
Comment on the effectiveness of isosurfaces for these medical datasets in your report. Isosurfaces in general are widely used in medical applications.
-
(a)What explanation can you propose for this success?
-
(b)Comment on the quality of the images you were able to obtain in each case.
-
(c)Discuss any shortcomings of the isosurfacing technique you may have come across in this assignment.
-
(d)Comment on the benefits and limitations of transparency and clipping planes to enhance the visualization.
Data Set
The datasets are available online at http://www.cs.purdue.edu/homes/cs530/Contents/Data/Project3/. All datasets are of type vtkStructuredPoints, which is itself a specialized type of vtkImageData.
Feet: CT (small, large), gradient magnitude (small, large)
Head: CT (small, large), gradient magnitude (small, large)
Submission
Submit your solution before March 3 2013 11:59pm using turnin. As a reminder, the submission procedure is as follows.
-
•Include all program files along with any other source code you may have
-
•Include Makefile or CMakeLists.txt file (if applicable). If you are using Visual Studio include the solution file (.sln) and the project files (.vcproj) that are needed to build your project.
-
•Include high resolution sample images showing results for each task
-
•Include a html report providing answers to all the questions asked. The report should include mid-res images with links to high-res ones.
-
•Include README.txt file with compilation / execution instructions (optional).
-
•Include all submitted files in a single directory
-
•Do not include binary files
-
•Do not include data files
-
•Do not use absolute paths in your code
After logging into data.cs.purdue.edu, submit your assignment as follows:
% turnin -c cs530 -p project3 <dir_name>
where <dir_name> is the name of the directory containing all your submission material.
Keep in mind that old submissions are overwritten by new ones whenever you execute this command. You can verify the contents of your submission by executing the following command:
% turnin -v -c cs530 -p project3
Do not forget the -v flag here, as otherwise your submission would be replaced by an empty one.