Our goal
We seek Ancestry Informative Markers (AIMs) that may be used to separate the following four (4) populations:
- Bedouin (47 subjects)
- Druze (46 subjects)
- Mozabite (28 subjects)
- Palestinian (51 subjects)
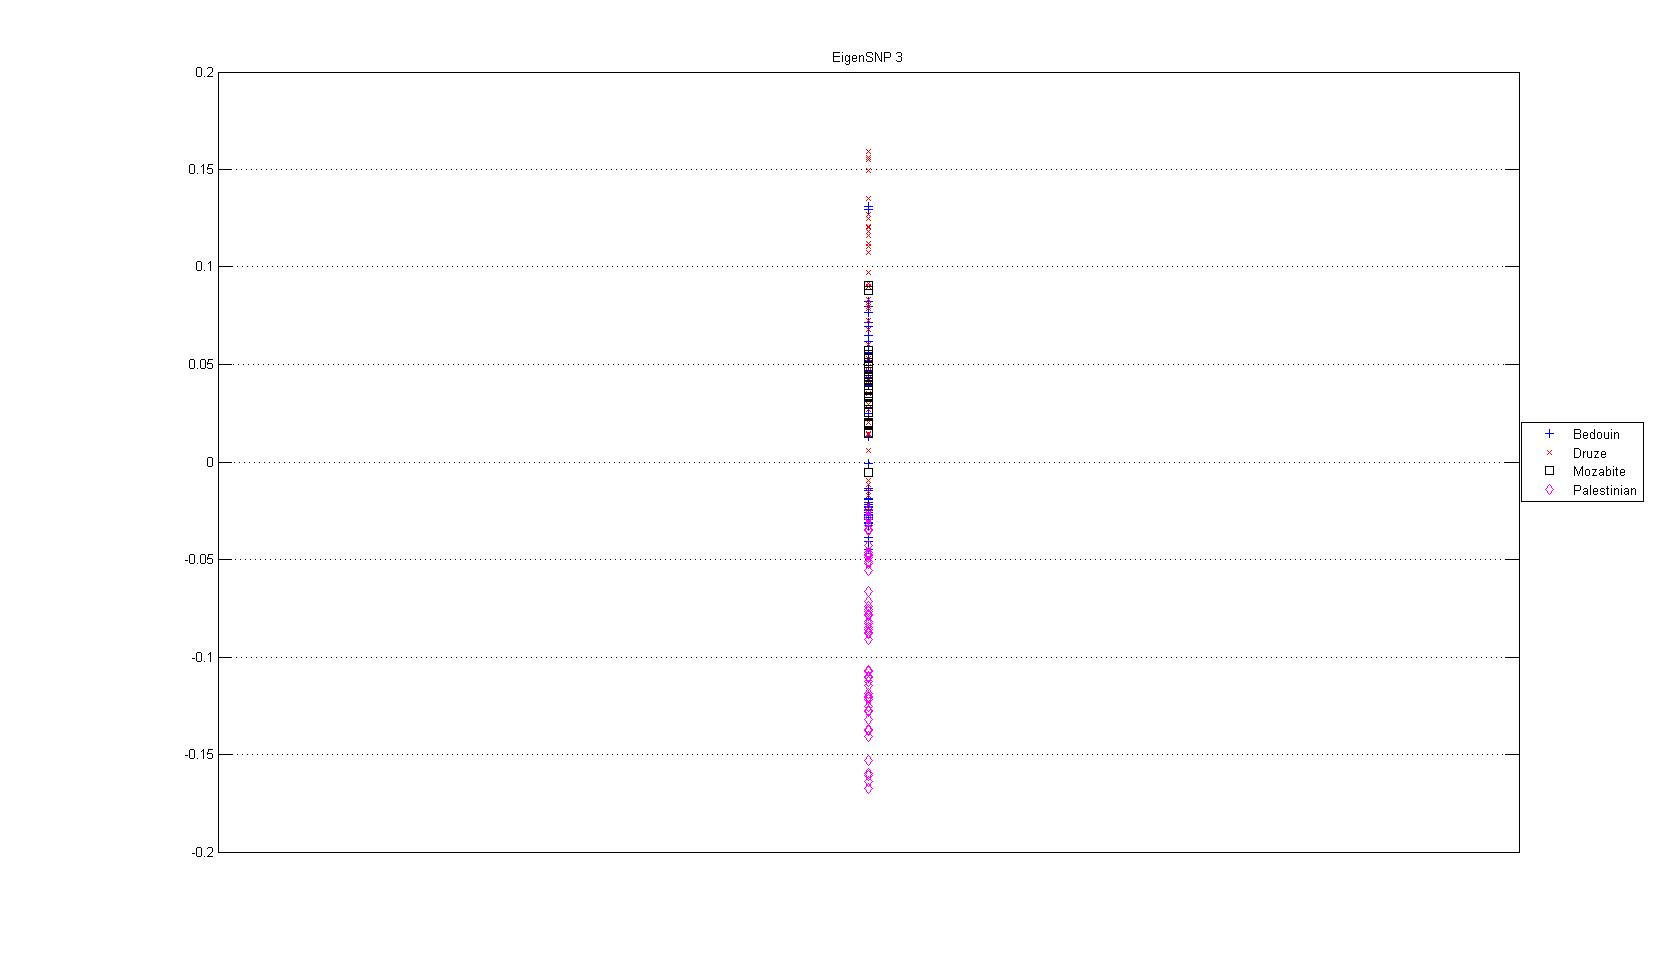
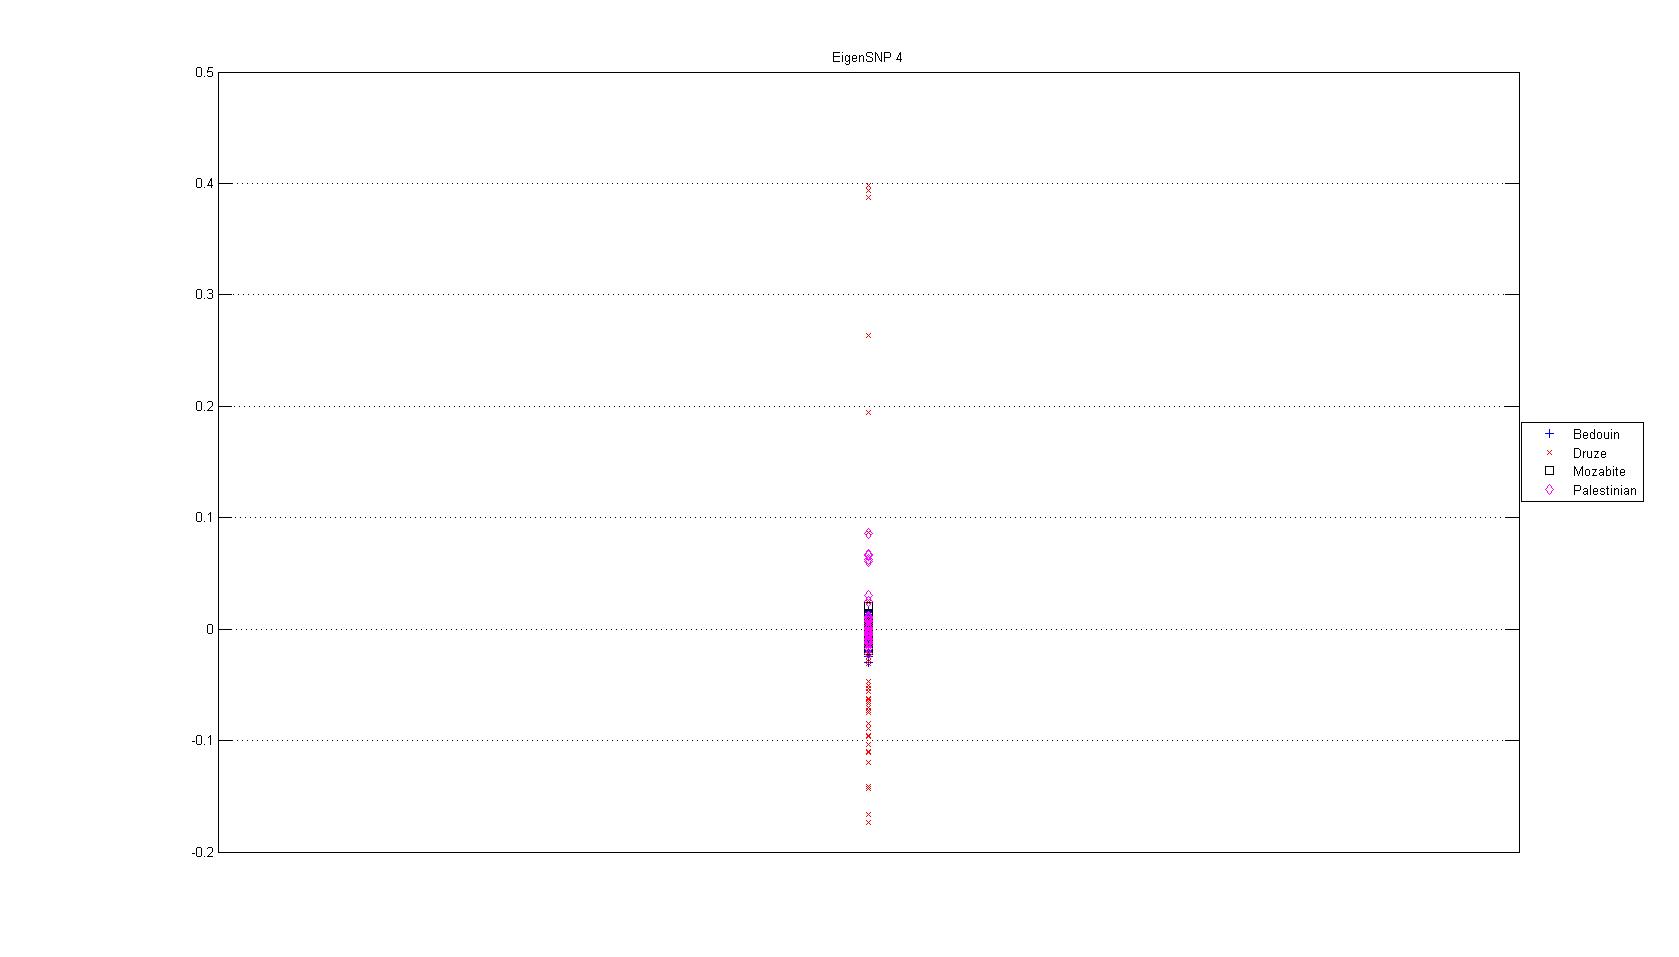
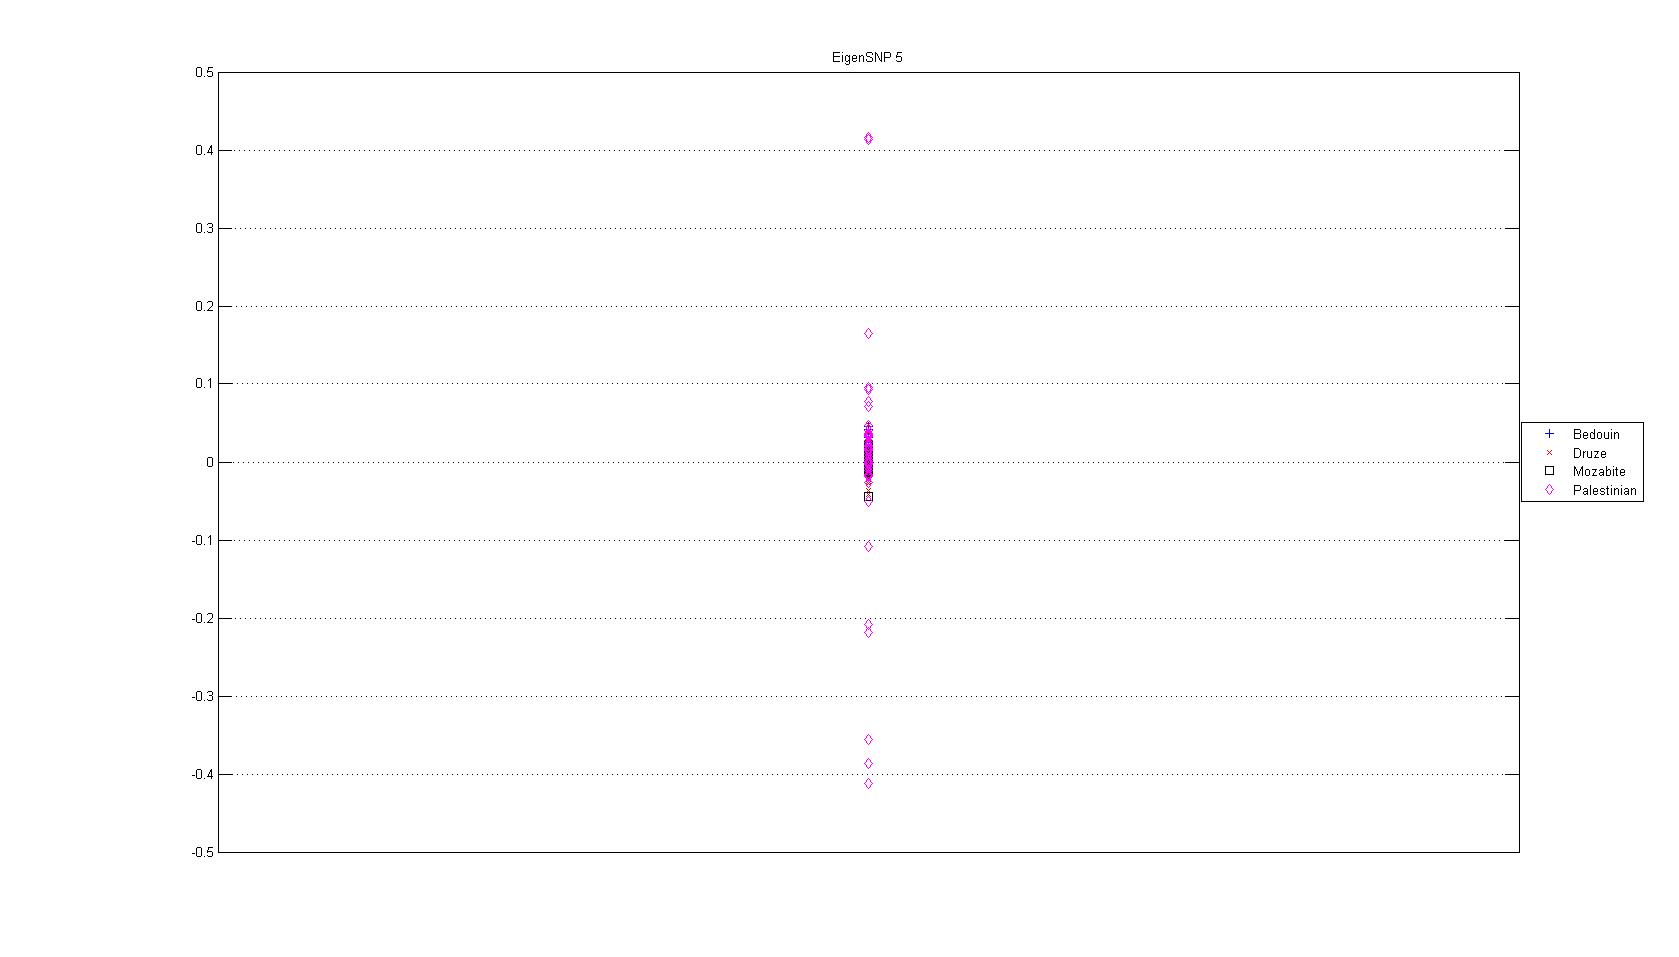
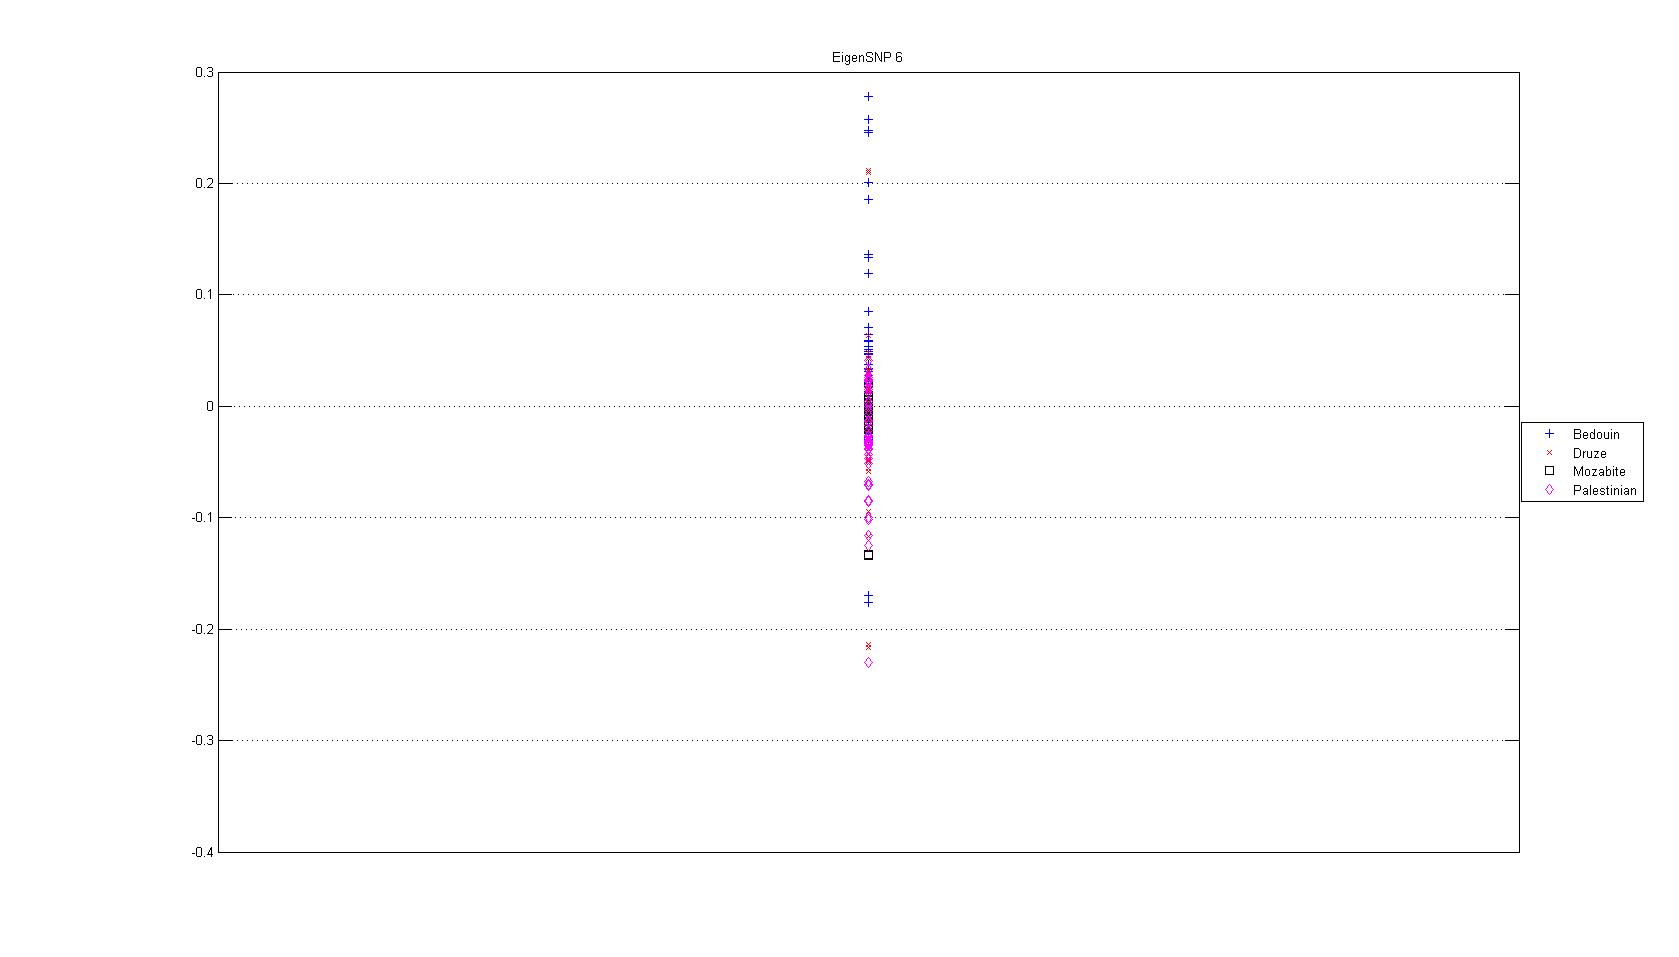
Principal Components Analysis
In
order to achieve the above separation via Principal Components Analysis
(PCA) and a simple five Nearest Neighbor (5-NN) algorithm, our analysis
indicated that we should retain the top six principal components
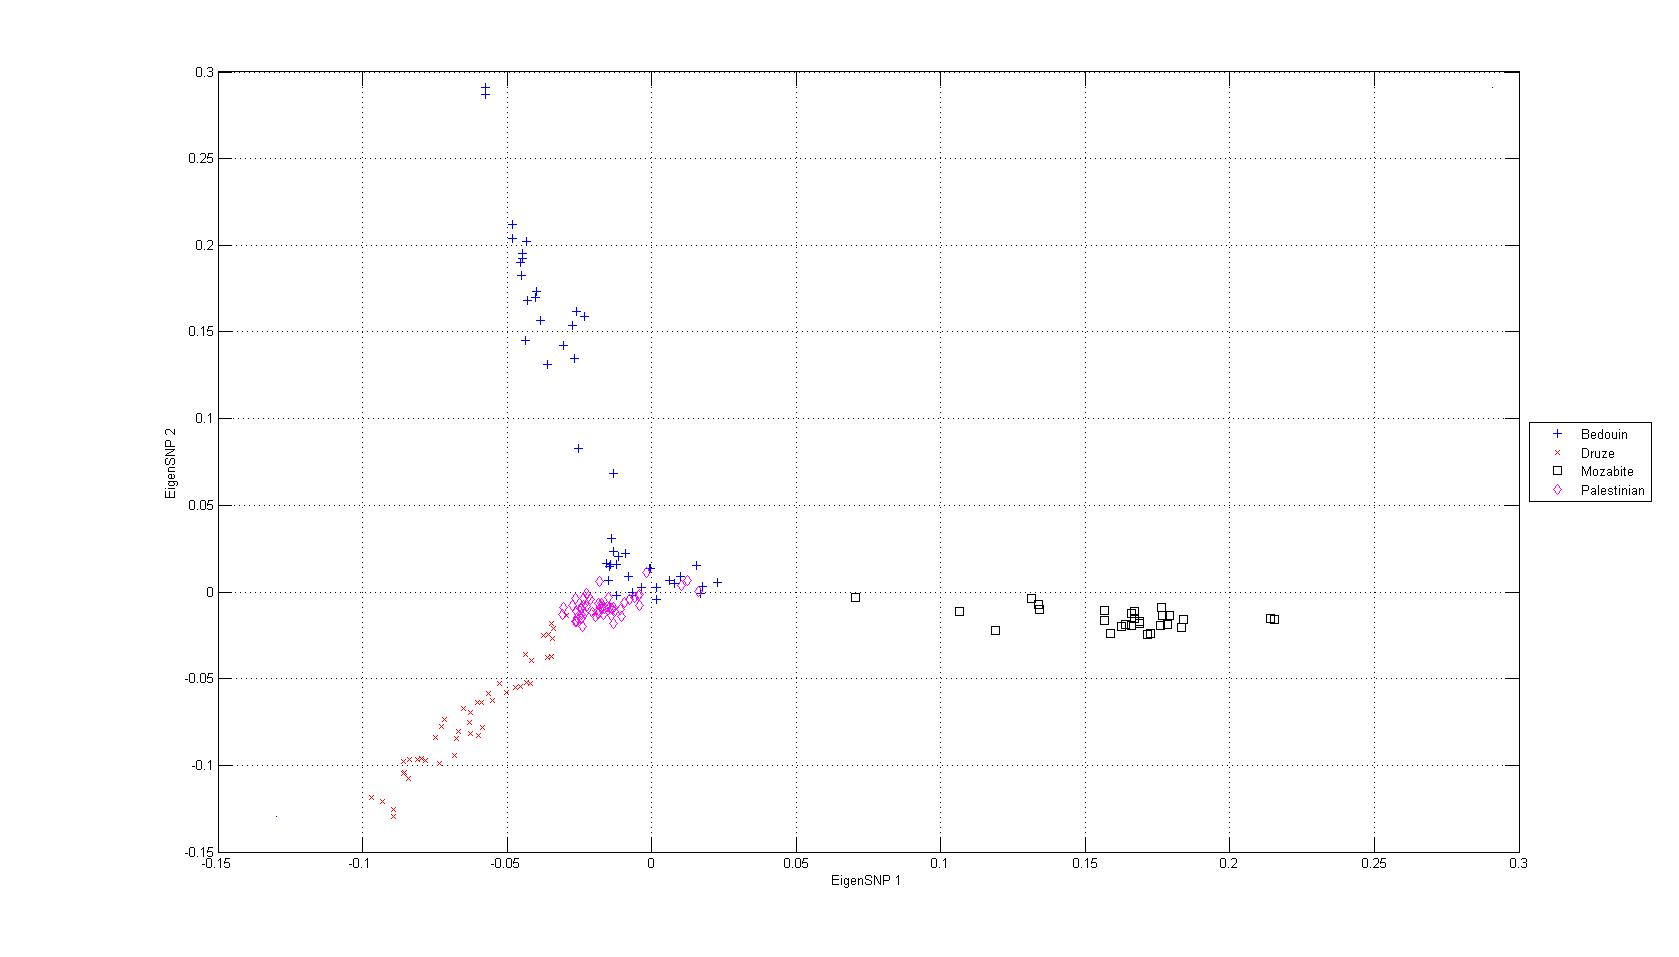
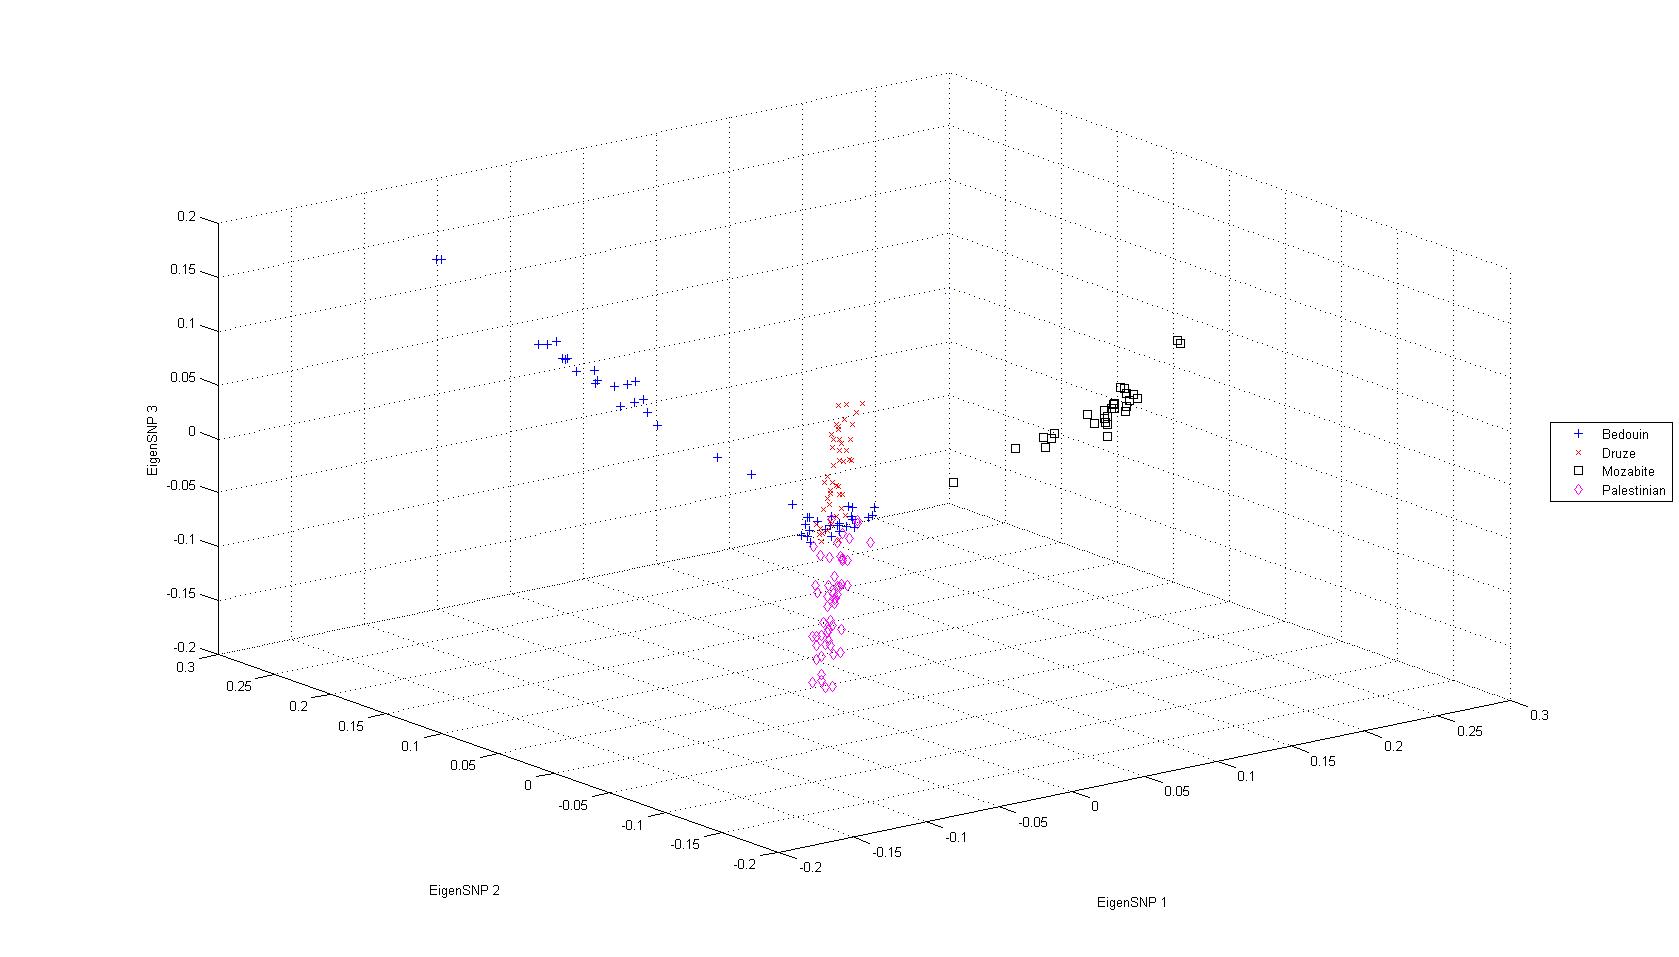
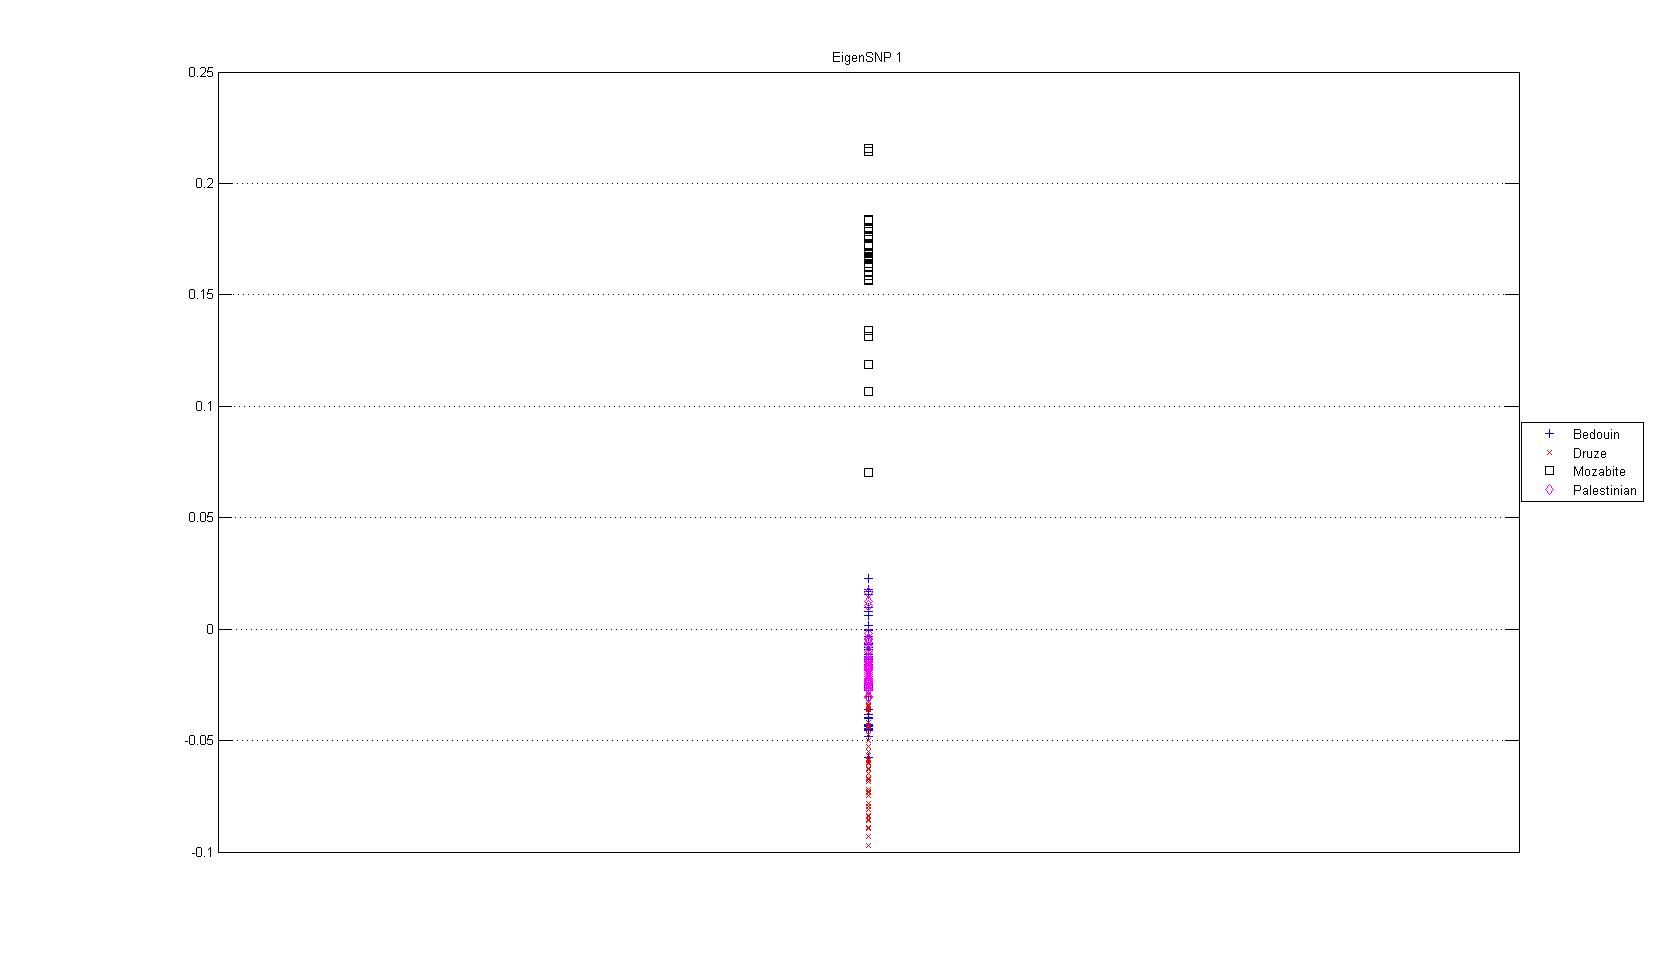
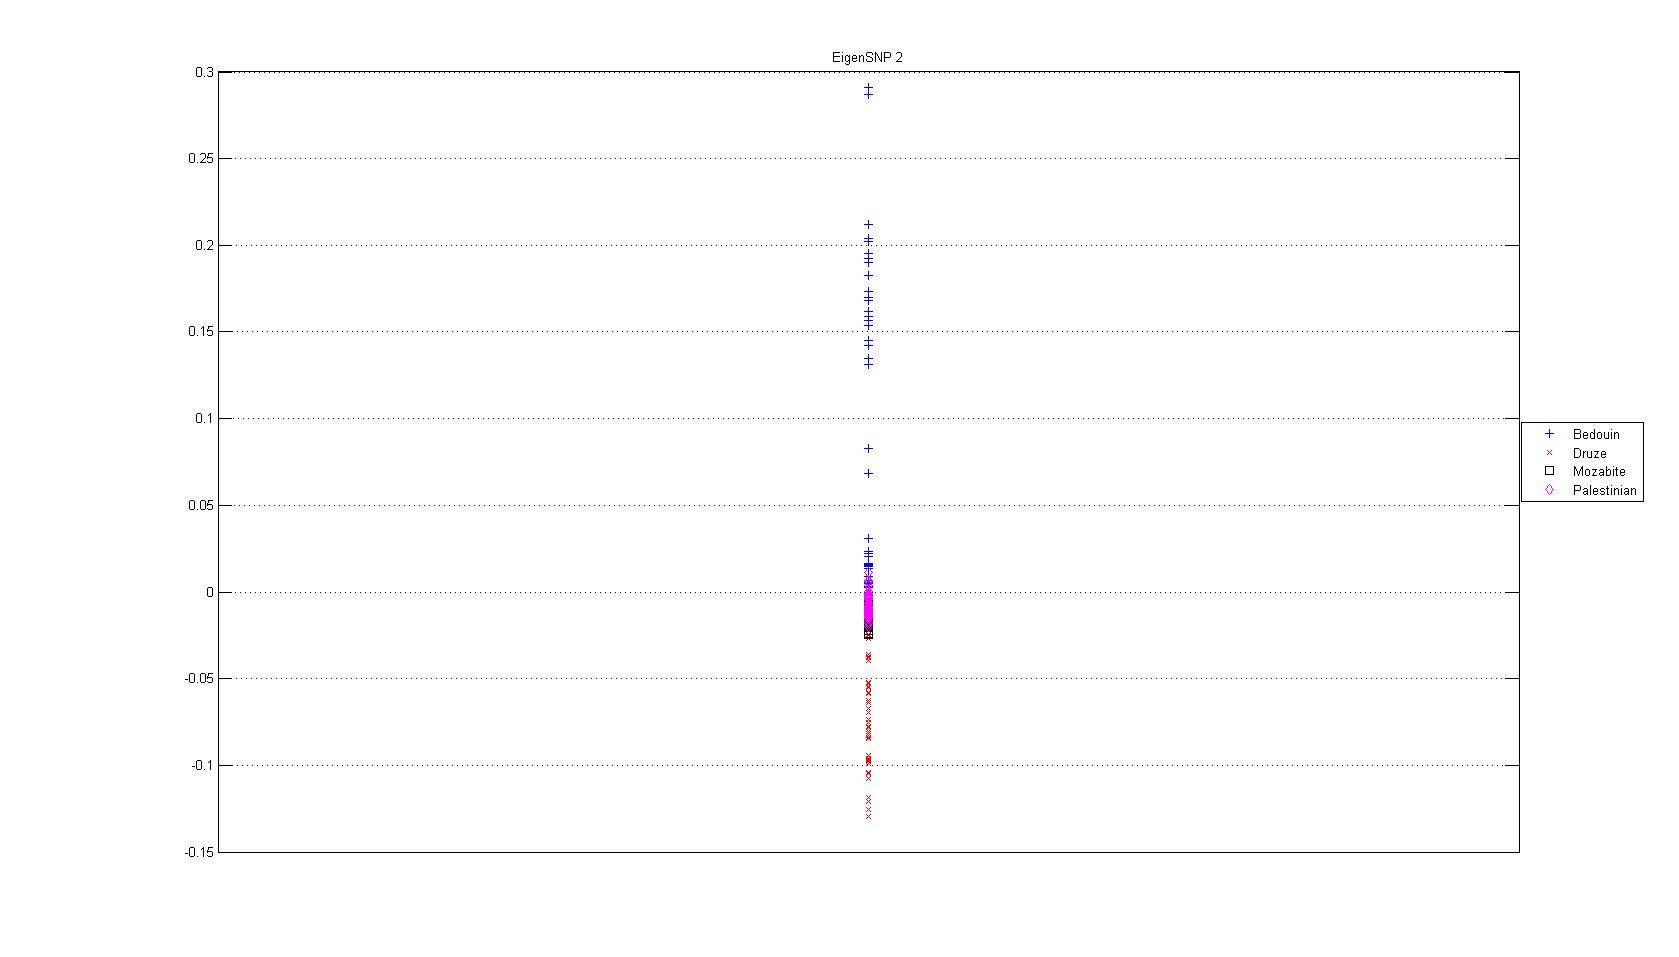
(eigenSNPs) in the data. The following plots show the projections of
the data on the top two eigenSNPs, on the top three eigenSNPs, as well
as on each of the top six eigenSNPs.
Selecting panels of AIMs using PCA scores
We first identified the top 5,000 PCA Informative Markers (PCAIMs
for short). These SNPs were selected using a simple metric of
correlation with the top six eigenSNPs (see Paschou et al 2007
for details). Significant "redundancies" are observed within the top
5,000 markers (for example, a considerable number of pairs of markers are in
linkage disequilibrium). In order to better summarize the top 5,000
PCAIMs, we clustered them in 300 clusters (the number of clusters was indicated by our analysis), and chose one representative
SNP from each cluster. (For each cluster, we chose the representative
SNP to be the one that has the highest PCA score, i.e., the one that
is most correlated with the top six eigenSNPs.) We provide the list of
all top 5,000 PCAIMs, as well as their cluster assignments and their
respective PCA scores. To some extent, SNPs within the same cluster
should be interchangeable in constructing and/or interpreting panels of
ancestry informative markers. (The file is tab-delimited; the first
column corresponds to cluster number, the second column corresponds to
SNP rs number, the third column corresponds to the SNP chromosome, the
fourth column links to the corresponding gene for intragenic SNPs, with
-- denoting intergenic SNPs, and the fifth column corresponds to the
PCA score of the SNP. The SNPs are sorted in descending order with
respect to their PCA score within each cluster, and the clusters are
sorted in descending order with respect to the highest PCA score among
all SNPs in the cluster.)
The
following 300 SNP panel was determined to be sufficient in order to
classify an individual to one of the aforementioned four populations. (The file is tab-delimited; the first column
corresponds to the SNP rs number, the second column corresponds to the
SNP chromosome, and the third column links to the corresponding gene
for intragenic SNPs, with -- denoting intergenic SNPs. The SNPs are
sorted in descending order with respect to their PCA score, i.e.,
their correlation coefficient with the top six eigenSNPs. Thus, the
first SNP is the most highly correlated SNP with the top six
eigenSNPs.)
We also provide two more panels of AIMs that emerged by clustering the top 5,000 PCAIMs in 600 and 900 clusters respectively. (The file is tab-delimited; the first column
corresponds to the SNP rs number, the second column corresponds to the
SNP chromosome, and the third column links to the corresponding gene
for intragenic SNPs, with -- denoting intergenic SNPs. The SNPs are
sorted in descending order with respect to their PCA score.)
Selecting panels of AIMs using the Informativeness metric
We also identified the top 5,000 Informative Markers (INFAIMs for short) according to the Informativeness for Assignment (In) metric described in Rosenberg et al 2003.
Again, significant "redundancies" are
observed within the top 5,000 markers. In order to better
summarize the top 5,000 INFAIMs, we clustered them in 300 clusters (see comment above) and
chose one representative SNP from each cluster. (For each cluster, we
chose the representative SNP to be the one that has the highest In
score.) We provide the list of all top 5,000 INFAIMs, as well as
their cluster assignments and their respective In scores.
To some
extent, SNPs within the same cluster should be interchangeable in
constructing and/or interpreting panels of ancestry informative
markers. (The file is tab-delimited; the first column corresponds to
cluster number, the second column corresponds to SNP rs number, the
third column corresponds to the SNP chromosome, the fourth column links
to the corresponding gene for intragenic SNPs, with -- denoting
intergenic SNPs, and the fifth column corresponds to the In score of
the SNP. The SNPs are sorted in descending order with respect to their In score within each cluster, and the clusters are sorted
in
descending order with respect to the highest In score
among all SNPs
in the cluster.)
Finally,
we provide a panel of 300 SNPs, ie. the SNPs with the highest In score in each of the 300 clusters described above. (The file is tab-delimited; the
first column corresponds to the SNP rs number, the second column
corresponds to the SNP chromosome, and the third column links to the
corresponding gene for intragenic SNPs, with -- denoting intergenic
SNPs. The SNPs are sorted in descending order with respect to their In
score.)
We also provide two more panels of AIMs that emerged by clustering the top 5,000 INFAIMs in 600 and 900 clusters respectively. (The file is tab-delimited; the first column
corresponds to the SNP rs number, the second column corresponds to the
SNP chromosome, and the third column links to the corresponding gene
for intragenic SNPs, with -- denoting intergenic SNPs. The SNPs are
sorted in descending order with respect to their In score.)
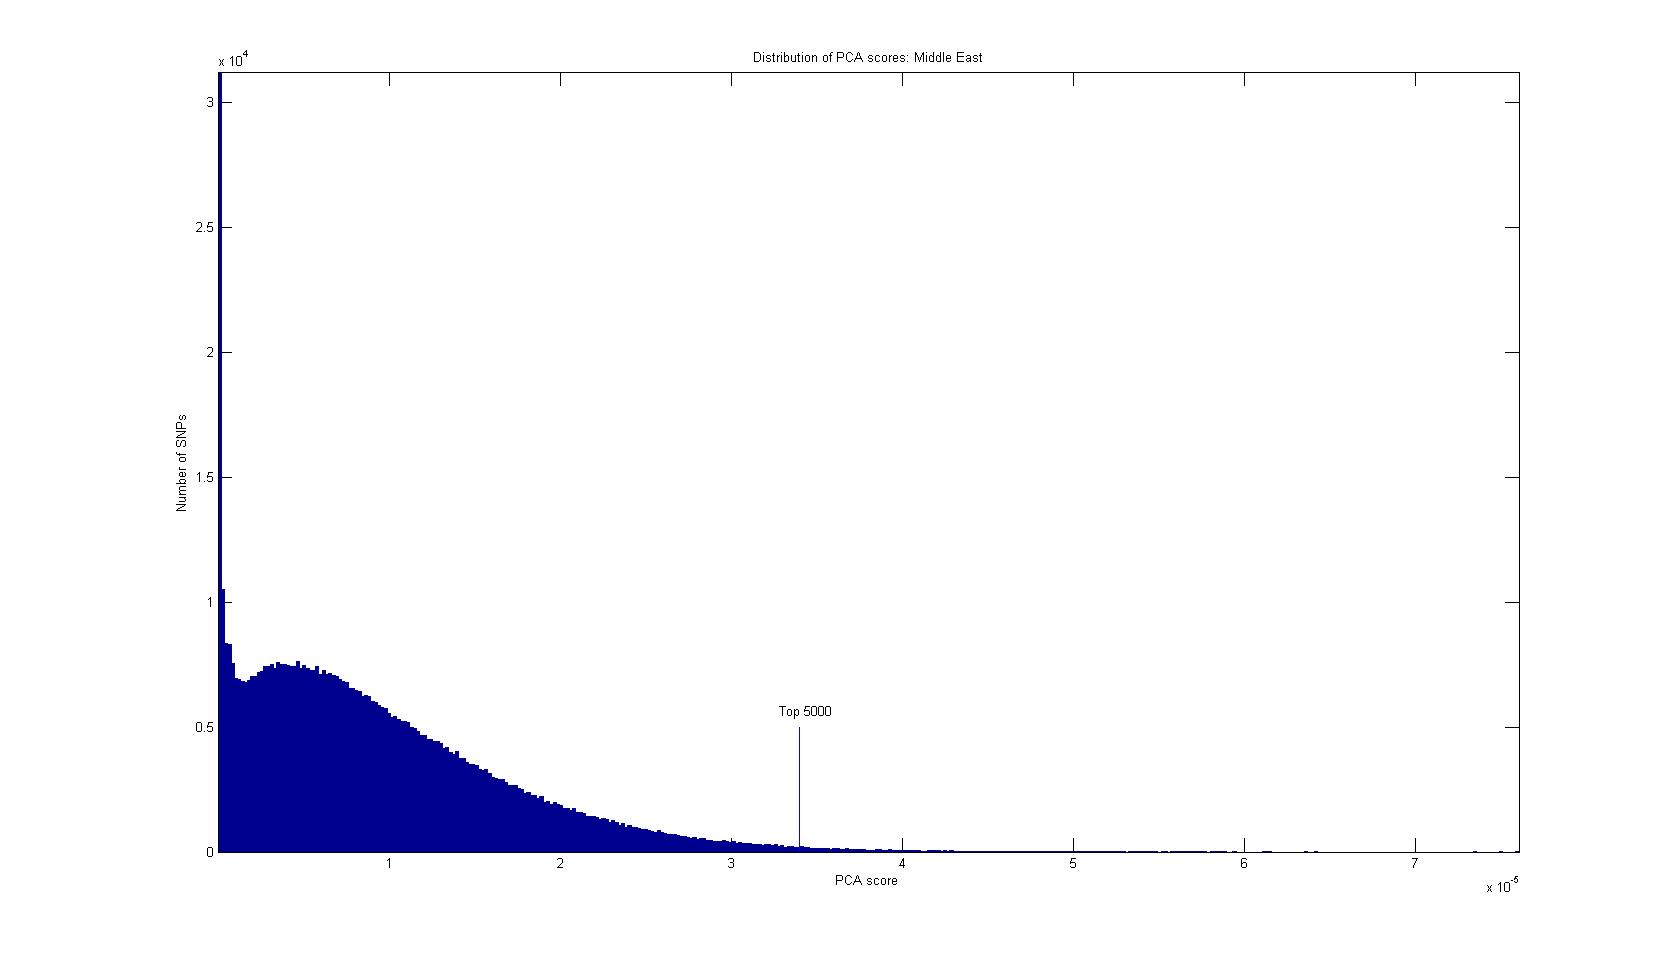
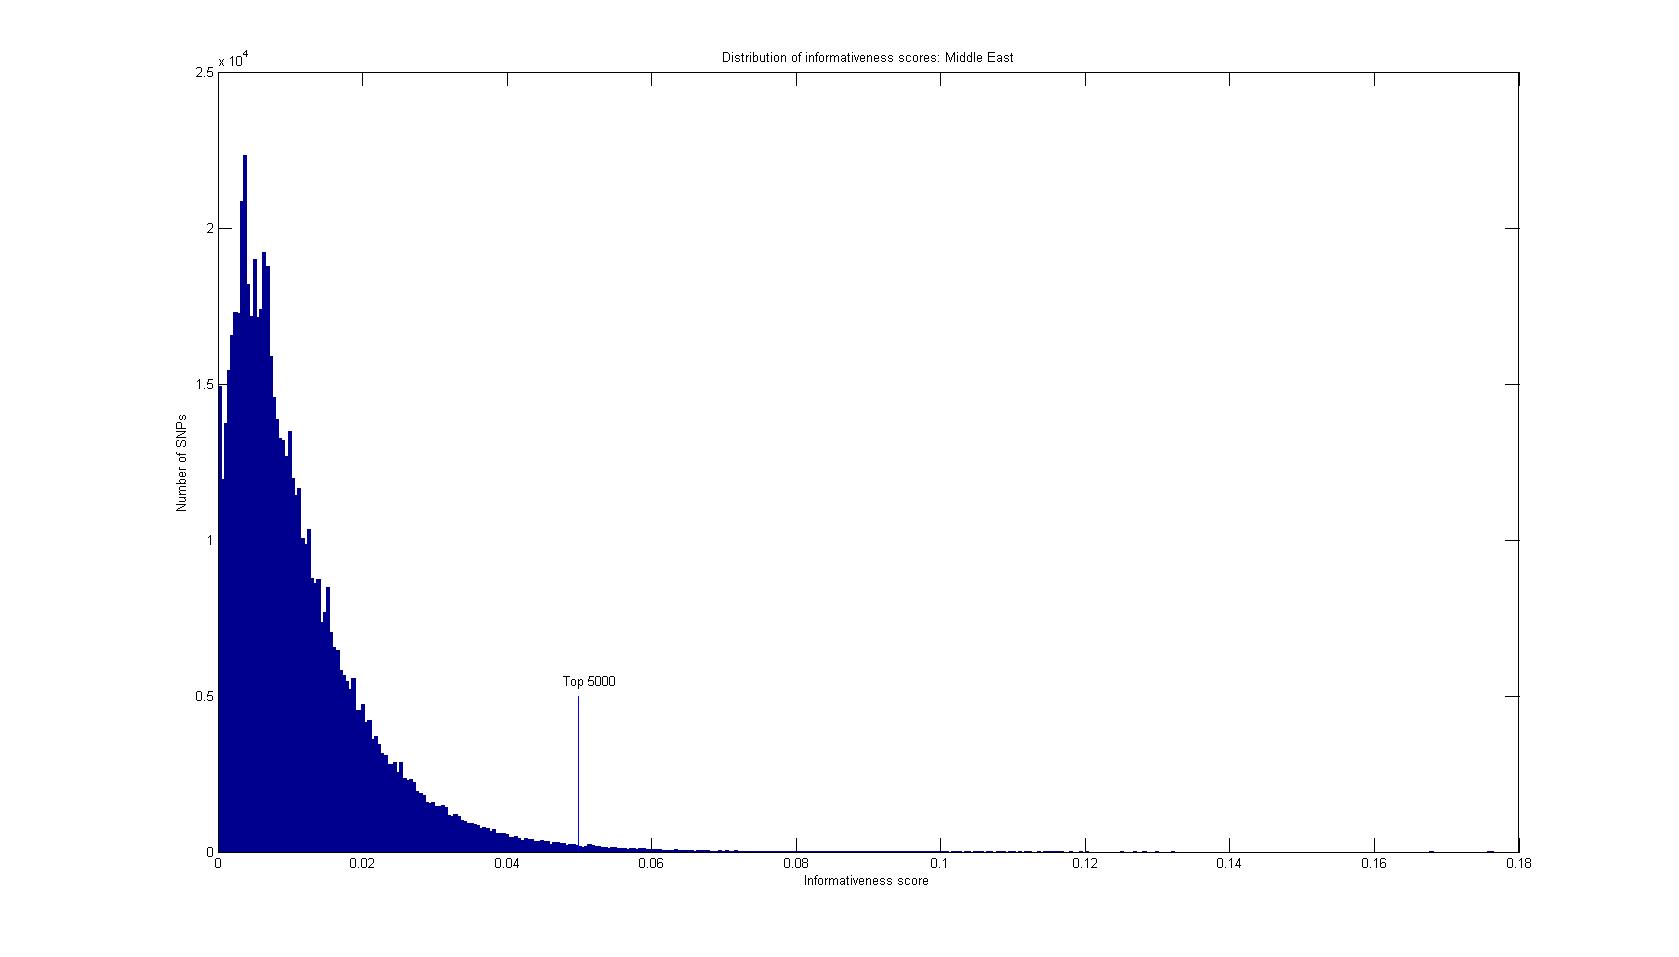
Overlap between the panels
There
were 851 common SNPs between the top 5,000 PCAIMs and the top 5,000
INFAIMs (a 17% overlap). The following two plots show the
distribution of the PCA scores as well as the In scores;
scores at the right of the vertical blue line correspond to the top
5,000 AIMs.