Contents
Generating an Erdos-Renyi graph
The Erdos-Renyi model is connect n vertices with probability p. Let's begin by setting these parameters for an example.
n = 150;
p = 0.01;
With these two parameters, we can instantiate the graph. The variable G is the adjacency matrix for the graph. However, the first step doesn't treat edges symmetrically. The last two operations fix this and yield a symmetric adjacency matrix.
rand('seed',100); % reseed so you get a similar picture
G = rand(n,n) < p;
G = triu(G,1);
G = G + G';
See, that was pretty easy right?
Seeing giant component
From the theory of Erdos-Renyi graphs, we know that a giant connected component should emerge whenever p > 1/(n-1)
thres_giant = 1/(n-1)
thres_giant =

    0.0067
Because p = 0.01 > 0.0067, we expect our graph to have such a giant component.
Using the Matlab interface to the AT&T Graphvis program neato, we can generate a layout for this graph and visualize it using the matlab gplot function. That way, we can see if it really does have a giant component.
[x y] = draw_dot(G);
gplot(G, [x' y'], 'o-');
axis off;
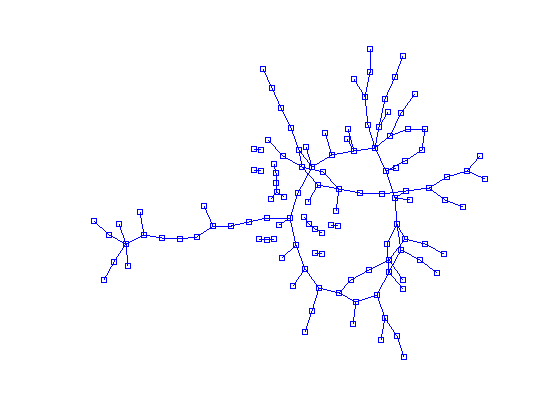
Notice how there is only one large connected set of vertices. Everything else is a small disconnected component.