Solutions to Assignment 2: Data Warehousing / Data Preparation

Start date 28 January, due 4 February beginning of class.

Exercises from the Book

Complete the following exercises from the book Chapters 2, 3.

  1. 2.5 a): Star Schema. Some people missed that spectator was defined to have a rate and type - attributes weren't given for others.
    schema diagram (1 point)
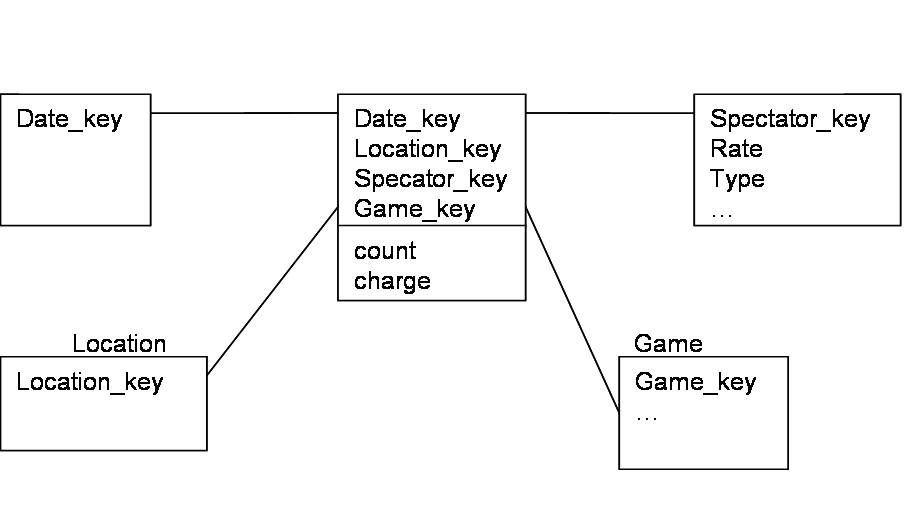
    b) slice/dice on spectator.type=student and location=GM_Place, year=2000; then Roll-up to remove game, date. (1 point)
  2. 2.9 a) Many good examples. Most were based on fine time granularities, but there are others - location granularity was another. (1 point)
  3. 3.2: See Han Section 3.2.1. I was looking to see some level of independent understanding. (1 point)
  4. 3.3 a) Bin and means: (13+15+16)/3 = 15, (16+19+20)/3 = 18, 21, 24, 27, 34, 35, 40, 56; replace each value by mean: 15, 15, 15, 18, 18, 18, 21, 21, 21, ... (0.75 point)
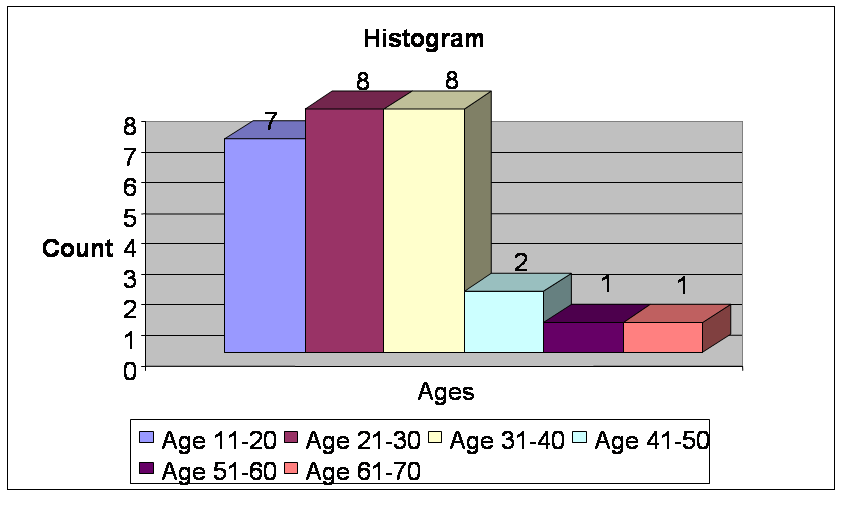
    b) One approach would be to identify values that differed significantly from their bin mean. One problem is that an item may be far from its bin mean, but closer to the mean of another bin (e.g., 46) - so distance from closest bin would make more sense. "Significant" is a challenge, though - an age of 7 would certainly seem an outlier in this data, but 46 doesn't seem to be - yet both are 6 from the nearest bin. (0.25 point)
  5. (0.5 point each)
    3.5 a) norm(x) = x-13/(70-13): 0.39
    b) norm(x) = (x-avg) / sdev = (35 - 30) / 13 = 0.38
    c) norm(x) = x/100 = .35
    d) My preference would be decimal scaling, as it preserves concepts of minimum and maximum age and relative distance. However, this would fail if anyone in the data set were over 100, since all ages would now be far from the maximum normalized value.
  6. 3.7 a) Several possible answers, depending on what you chose as the base age. One is (courtesy Mike Hilligoss):
    Histogram (1 point)

Valid XHTML 1.1!